
If you want to stand out as a freelance writer, incorporating data into your content is one of the best ways. Clients wish to write what sounds good, feels solid, and is trustworthy. Data gives you that edge.
In this article, you’ll learn why data matters, where to find it, how to use it, and which tools can help. Whether you write blogs, emails, or white papers, these tips will strengthen your content and make it more professional.
Everything I’ve shared here—and more—is in my book, available on Amazon. Click the link if you’re ready to level up.
Why Incorporating Data Helps You Win More Freelance Work
Want to land more freelance writing gigs and keep clients coming back? Using data in your content makes your writing more credible, engaging, and results-driven.
Builds Credibility and Trust
Clients trust writers who back up claims with facts. Anyone can say something, but not everyone can prove it. When you use data, you show you’ve done your homework.
Readers trust numbers, too. If you’re writing about remote work, saying “more people are working remotely” sounds vague. But saying “35% of U.S. employees worked remotely all of the time in 2023” sounds real.
As a freelancer, trust is everything. When clients trust your work, they come back. They also refer you to others.
Strengthens Arguments and Increases Engagement
Good writing keeps readers interested. Strong writing makes them believe you. Adding stats or trends helps you do both.
If you write about email marketing and say it works well, that’s okay. But if you say, “Email marketing returns $36 for every $1 spent,” your content becomes more convincing.
Data helps support your message. It also gives readers something they can remember and share.
Incorporating Data Supports SEO and Client KPIs
Search engines like Google reward content that shows experience and expertise. Including stats, sources, and citations helps boost your E-E-A-T score (Experience, Expertise, Authoritativeness, Trustworthiness), which is good for SEO.
Data also helps your clients measure results. If you link to sources and include charts or trends, your writing becomes easier to track and more useful in reports.
How Data Supports SEO Performance (Beyond E-E-A-T)
When you incorporate data well, you don’t just sound credible—you make the content easier to evaluate and use, which can improve performance signals clients care about, such as:
- Time on page: charts, comparisons, and examples keep readers engaged
- Backlink potential: well-sourced stats get referenced by other writers
- Conversions: data can make CTAs feel safer (“this works, here’s proof”)
- Repurposing: clients can lift your stats into decks, newsletters, and sales enablement
If your client tracks KPIs like leads, sign-ups, demo requests, or CTR, data gives your writing a measurable “why now.”
Where to Find Reliable and Relevant Data
Finding the right data doesn’t have to be hard—you need to know where to look. Whether you’re writing about health, finance, or marketing, using trusted sources will strengthen and improve your content.
General Data Sources for Freelancers
There are many free, trusted places online where you can find up-to-date stats:
- Pew Research Center (URL: pewresearch.org/) – Great for social, tech, and workplace trends
- Statista (URL: statista.com/) – Wide range of charts and global data
- Google Trends (URL: trends.google.com/) – See what people are searching for
- World Bank Data (URL: data.worldbank.org/) – Good for worldwide development and economic topics
- Think with Google (URL: thinkwithgoogle.com/) – Insights for marketers and creatives.
These sites are helpful across niches. Statista often shows data in charts, which saves you time when you need visuals.
Niche-Specific Sources for Common Client Needs
You can also find trusted sources based on the type of writing you do:
- Health Writing:
- Centers for Disease Control and Prevention (CDC) (URL: cdc.gov/)
- World Health Organization (WHO) (URL: who.int/)
- Mayo Clinic (URL: mayoclinic.org/)
- Finance Writing:
- Bureau of Labor Statistics (BLS) (URL: bls.gov/)
- Federal Reserve (URL: federalreserve.gov/)
- Investopedia (URL: investopedia.com/)
- Marketing and Tech:
- Semrush Industry Reports (URL: semrush.com/research/)
- HubSpot Research (URL: research.hubspot.com/)
- Content Marketing Institute (URL: contentmarketinginstitute.com/)
Knowing where to look can save you hours of research and help you sound like an expert in your niche.
Vetting and Incorporating Client-Provided Data
Sometimes clients give you reports, spreadsheets, or stats. Make sure the data is:
- Clear and easy to understand
- Recent (within the last 1–2 years)
- From a reliable source
If it’s messy, ask questions. Don’t guess. It’s better to delay a draft than risk using bad numbers.
You can also clean up the data or simplify it for the reader. If a spreadsheet has 20 rows, find the 1 or 2 stats that matter most.
Quick Credibility Checklist (So You Don’t Publish Weak Stats)
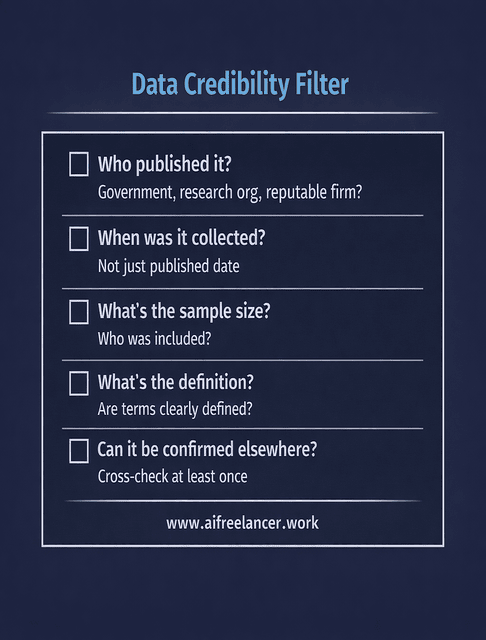
Before you use any number, check:
- Who published it? (government, research org, reputable firm, peer-reviewed)
- When was it collected? (not just “published,” but the data collection date)
- What’s the sample? (size, geography, audience)
- What’s the definition? (“remote work” can mean hybrid, full-time, or occasional)
- Can you confirm it elsewhere? (one more source reduces risk)
This keeps your writing clean—and protects client trust.
How to Incorporate Data Effectively in Client Projects
Data only works when used correctly. Smart placement, clear storytelling, and proper context turn simple numbers into powerful points that support your writing and impress your clients.
Choose and Place Stats with Purpose
Don’t stuff your writing with numbers. One strong stat per section is usually enough.
Use data where it adds value. Good spots include:
- Introductions – to frame the topic
- Subheadings – to grab attention
- Calls to action – to show urgency or impact
Keep stats short and punchy. Write them in a way that’s easy to understand.
Example:
- Instead of: “There has been a slight increase in online shopping.”
- Try: “Online sales jumped 8.7% during the 2023 holiday season.”
Step-by-Step: A Simple “Incorporating Data” Workflow (10 Minutes per Section)
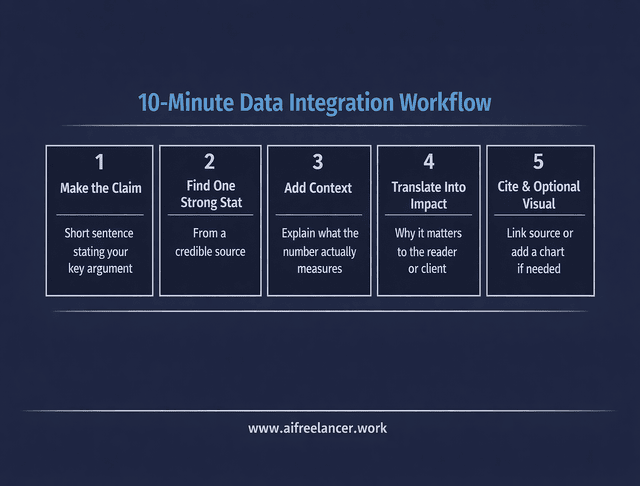
- Make the claim (what you want the reader to believe)
- Find one strong stat (from a credible source)
- Add context (what the stat measures, and why it matters)
- Translate into impact (“what this means for you/your business”)
- Cite it (link or attribution)
- Optionally visualize (chart/table if it improves clarity)
If a stat doesn’t strengthen the claim or change the reader’s decision, cut it.
Incorporating Data into Storytelling
Numbers alone don’t stick. People remember stories.
Connect the data to a real-world example. For instance:
“In 2024, Gen Z made up 25% of TikTok users in the U.S., which shows why short-form video keeps growing.”
Use comparisons, too. They make things feel more real:
“According to Oberlo, TikTok’s user base expanded by 19.7% in 2022, while Facebook’s growth was a mere 0.6%.”
Always bring it back to the client’s audience. Ask: “What does this stat mean for them?”
A Copy-Paste Paragraph Template You Can Use in Drafts
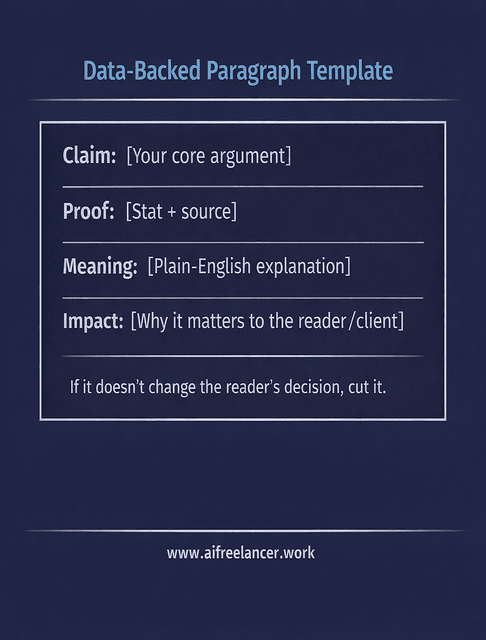
Example (fill-in style):
“[Claim]. In [year], [source] found [stat]. That means [plain-English meaning]—which matters because [impact on reader/client outcome].”
Cite, Format, and Add Context
Always give credit. If you’re quoting a stat, provide a link to the source or mention it.
Use bullet points, charts, or callout boxes to highlight key numbers. This makes them easier to scan.
Also, explain the context. A stat from 2019 might seem useful, but if trends have changed, it could be misleading.
When to Use a Chart vs. a Single Stat
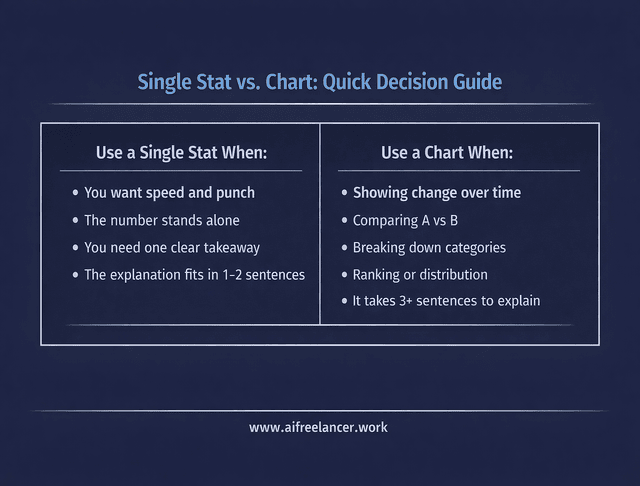
Use a single stat when you want speed and punch.
Use a chart/table when you need to show:
- change over time (trend)
- comparison (A vs. B)
- distribution (breakdown by group)
- ranking (top 5 / bottom 5)
If it takes more than 3 sentences to explain the number, that’s often a sign that a visual will help.
Tools to Make Incorporating Data Work Easier for Freelance Writers
The right tools can save you hours and make your writing process smoother. AI writing platforms and other apps help you work faster and deliver polished, professional content, from finding data to creating visuals.
Find and Summarize Data Fast
Use these tools to save time:
- ChatGPT (URL: chat.openai.com/) – Paste a report and ask for a summary or top insights
- Perplexity (URL: perplexity.ai/) – Ask a question and get sourced answers fast
- Google Dataset Search (URL: datasetsearch.research.google.com/) – Find raw data from across the web
- Exploding Topics (URL: explodingtopics.com/) – Spot fast-growing trends early
These tools help you pull out key info without having to read 50 research papers.
A Safer Way to Use AI With Stats (So You Don’t Hallucinate Numbers)
Use AI to summarize and format data you already have—then verify:
- Paste the source excerpt or report section
- Ask for “top 3 insights” or “turn this into a reader-friendly explanation.”
- Do not ask AI to invent stats or “find a number” without a source
- Confirm the stat matches the source before publishing
This keeps you fast and accurate.
Create Simple, Clear Visuals
Clients love visuals. They boost SEO and look great on blogs.
Use these:
- Canva (URL: canva.com/) – Easy drag-and-drop infographics
- Datawrapper (URL: datawrapper.de/) – Simple, clean charts
- Google Sheets (URL: google.com/sheets/about/) – Basic tables and graphs
- Flourish (URL: flourish.studio/) – Interactive visuals for advanced content
If your client has brand colors or style guides, match them in your visuals.
Stay Organized and Accurate
Keep track of your sources and notes. These tools help:
- Zotero (URL: zotero.org/) – Store and cite sources
- Grammarly (URL: grammarly.com/) – Double-check clarity and tone
- Notion (URL: notion.so/) or Obsidian (URL: obsidian.md/) – Build a personal research library
You don’t need every tool, but picking one or two can speed up your workflow.
Minimal “Source Tracking” System (So You Never Lose Citations)
For each stat you use, store:
- the exact sentence you’ll publish
- the source name + link
- the date accessed
- a quick note: “why this matters.”
This prevents last-minute scrambling and keeps client edits painless.
Final Thoughts
When you use data, you become more than a freelance writer. You become a strategist. You help clients reach more people, earn more trust, and get real results.
Start small. Add one good stat to your next blog post. Then try a chart. Soon, data will become a natural part of your writing process.
Incorporating data shows you care about the facts. And that makes clients care about you.
If you want to turn insight into income and build a calmer, smarter writing workflow, explore the books and practical guides on my Amazon Author page. You’ll find step-by-step frameworks, decision tools, and AI-powered systems designed specifically for freelance writers who want better results without burning out.
Frequently Asked Questions About Incorporating Data
Start by identifying one or two key stats that directly support your main point, then weave them into your sentences instead of dumping a long list of numbers. Attribute each stat to a credible source and briefly explain what it means for the reader or the client’s audience.
Data makes your content more credible, persuasive, and useful. It shows clients you’ve done the research, helps readers trust your claims, and supports SEO by signaling experience and expertise when you cite reputable sources.
Reliable options include government databases, industry reports, academic studies, and respected organizations in your niche (for example, Pew Research, World Bank, CDC, or HubSpot Research). Whenever possible, go back to the original study instead of quoting secondhand summaries.
Keep stats simple, specific, and focused on one idea at a time. Use comparisons, plain language, and, when helpful, visuals like charts or infographics to make numbers more memorable and easier to scan.
Review key stats at least once a year, or more often in fast-changing fields like tech, marketing, or finance. If new numbers significantly change the story or recommendations, update the content and, if needed, note the new date or version for clients.

Florence De Borja is a freelance writer, content strategist, and author with 14+ years of writing experience and a 15-year background in IT and software development. She creates clear, practical content on AI, SaaS, business, digital marketing, real estate, and wellness, with a focus on helping freelancers use AI to work calmer and scale smarter. On her blog, AI Freelancer, she shares systems, workflows, and AI-powered strategies for building a sustainable solo business.


Pingback: Efficient Task Management for Writers: Trello and Asana - The AI Freelancer